DATA MINING & VISUALIZATION — MILITARY TECHNICAL COLLEGE

Hotel Reservation &
Billing Intelligence System

A comprehensive end-to-end data mining and visualization project by the Snipers Team. We engineered a production-grade relational database, performed a 20-question EDA on 119,390 bookings, and built predictive ML models — all supervised by Dr. Mohamed El Shafey.

119,390
BOOKING RECORDS
11
DATABASE TABLES
10
SQL VIEWS
0.86
MODEL AUC
37%
CANCEL RATE
MTC DiGiLiANS
Military Technical College · Digital Pioneers Initiative · Ruwad Al-Raqmiyoun · DiGiLiANS
Supervised by Dr. Mohamed El Shafey · March 2026
Filter:

About This Project

A full-cycle data engineering and analytical intelligence project built on a real-world Portuguese hotel booking dataset.

Part 1 — Database Engineering8 pts
  • Normalized relational schema — 11 entities, 4 functional domains, 3NF throughout
  • Full SQL Server implementation with PK/FK, CHECK, and UNIQUE constraints
  • 4-stage bulk insert pipeline: Stage → Validate → Normalize → Error-log
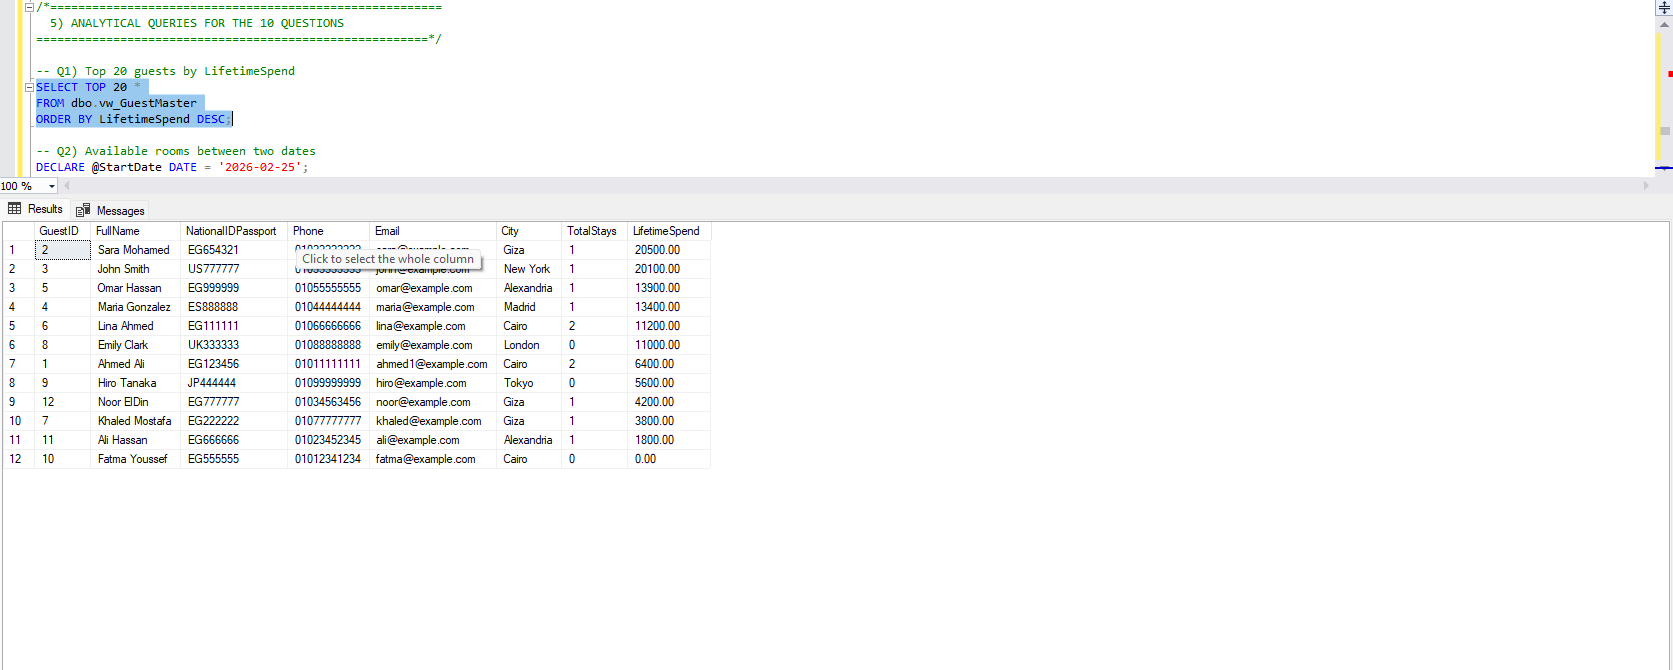
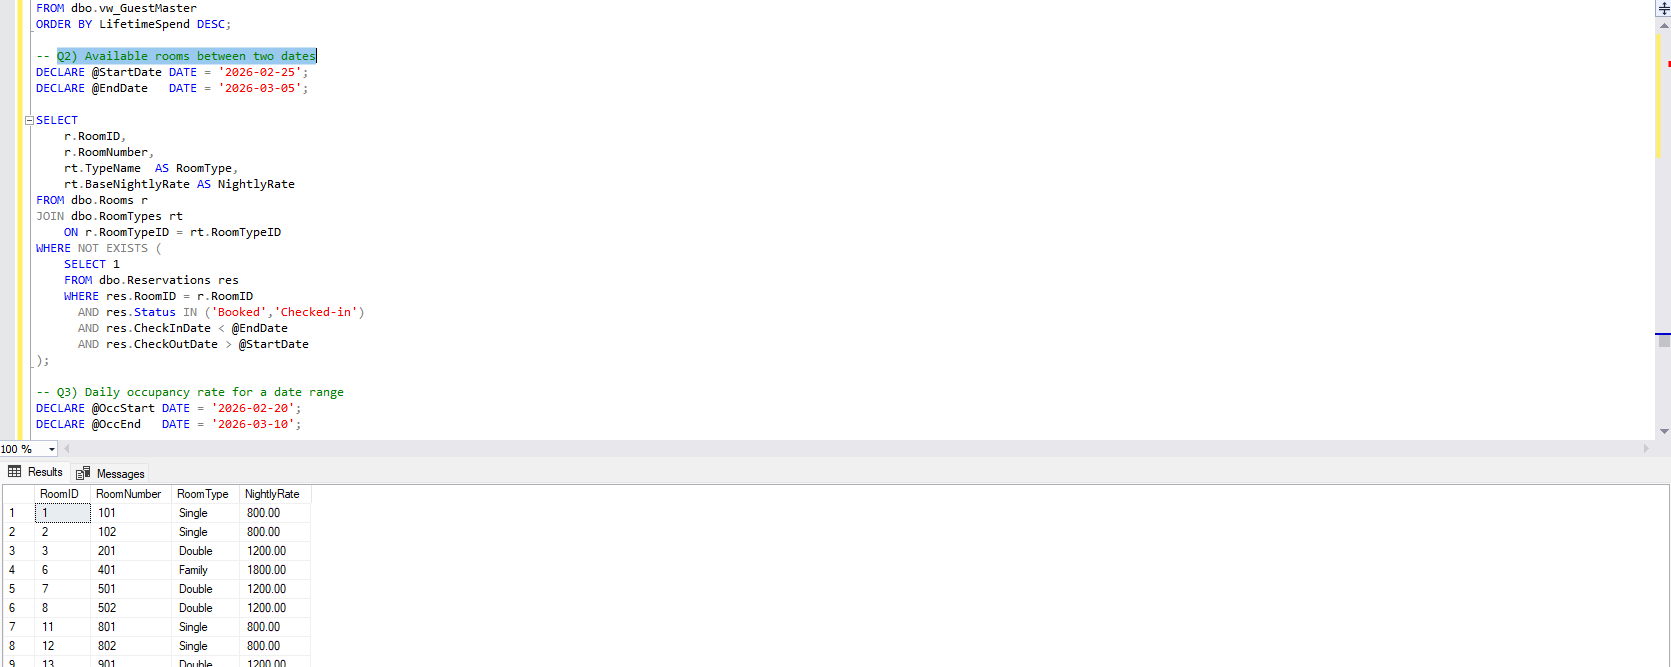
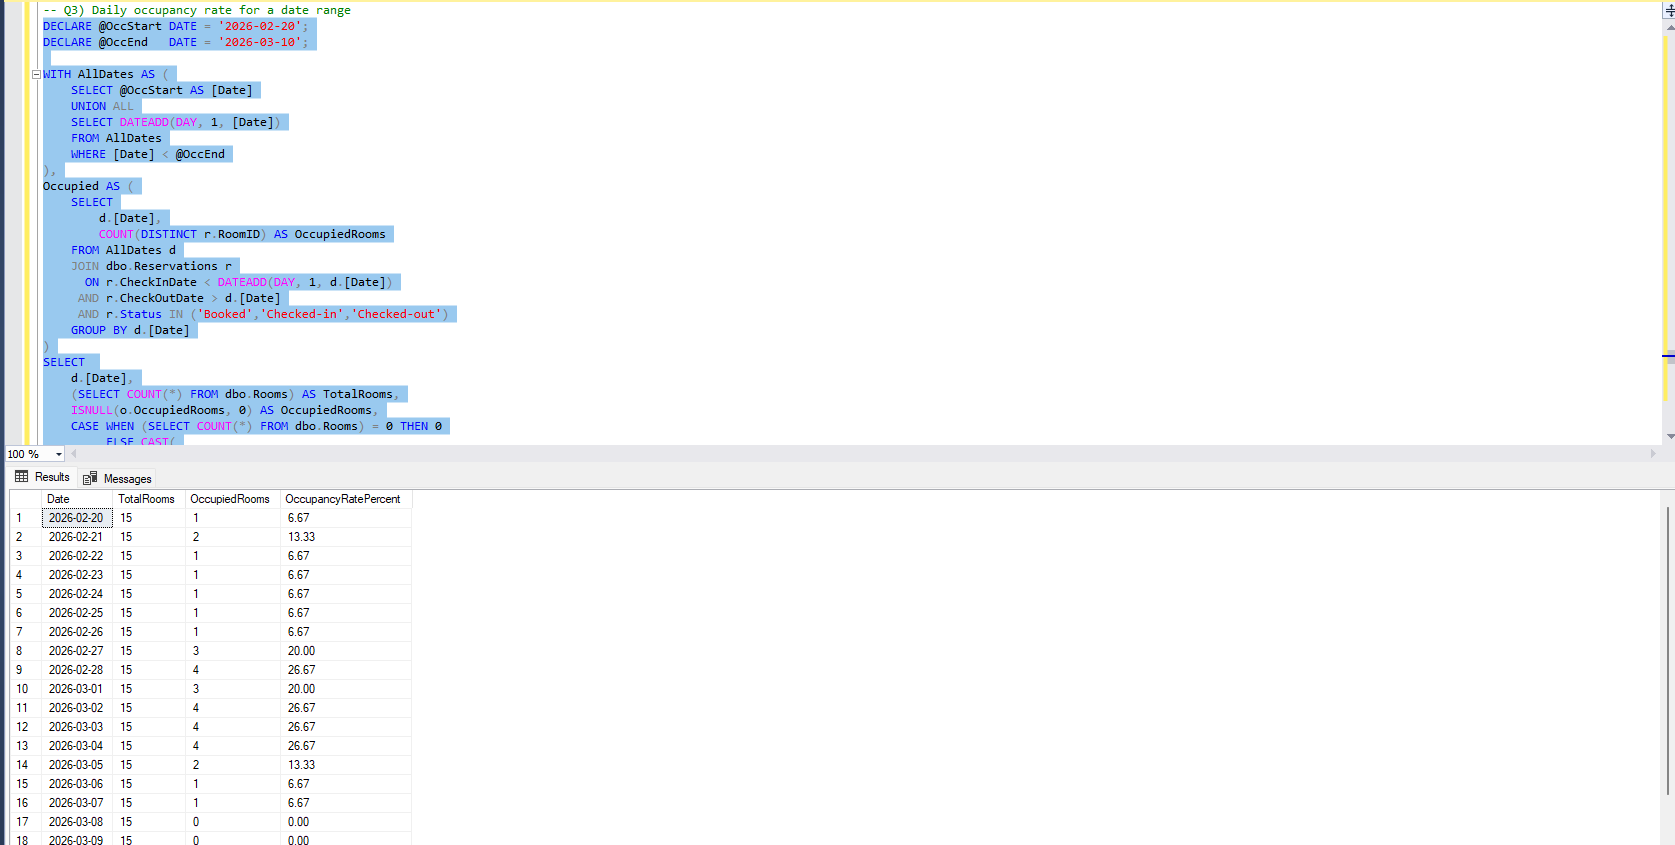
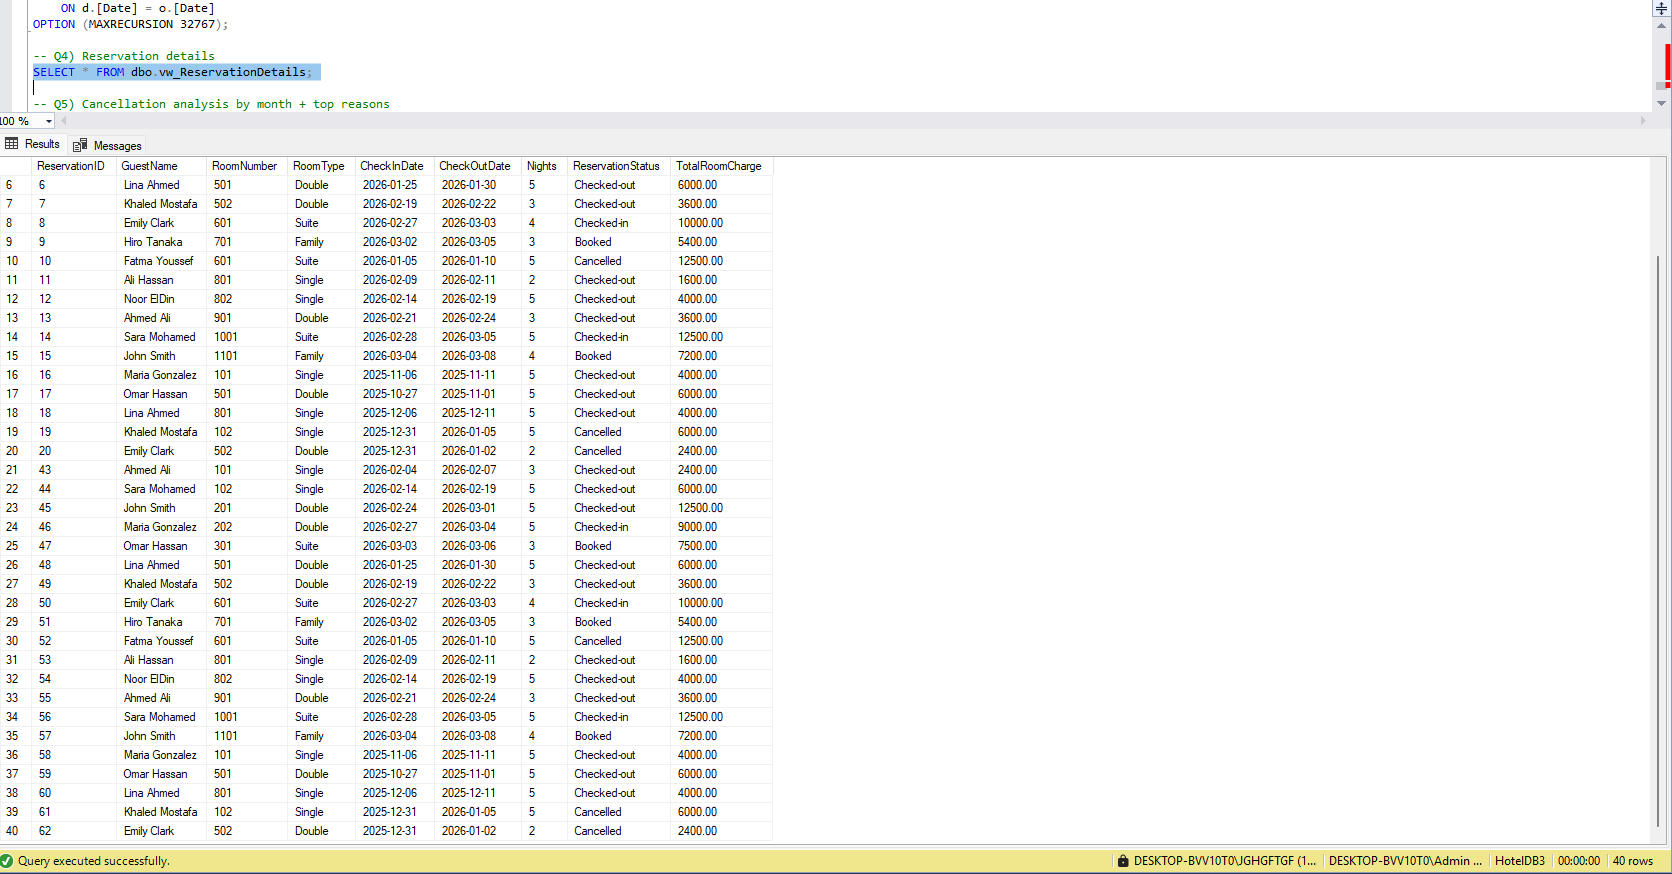
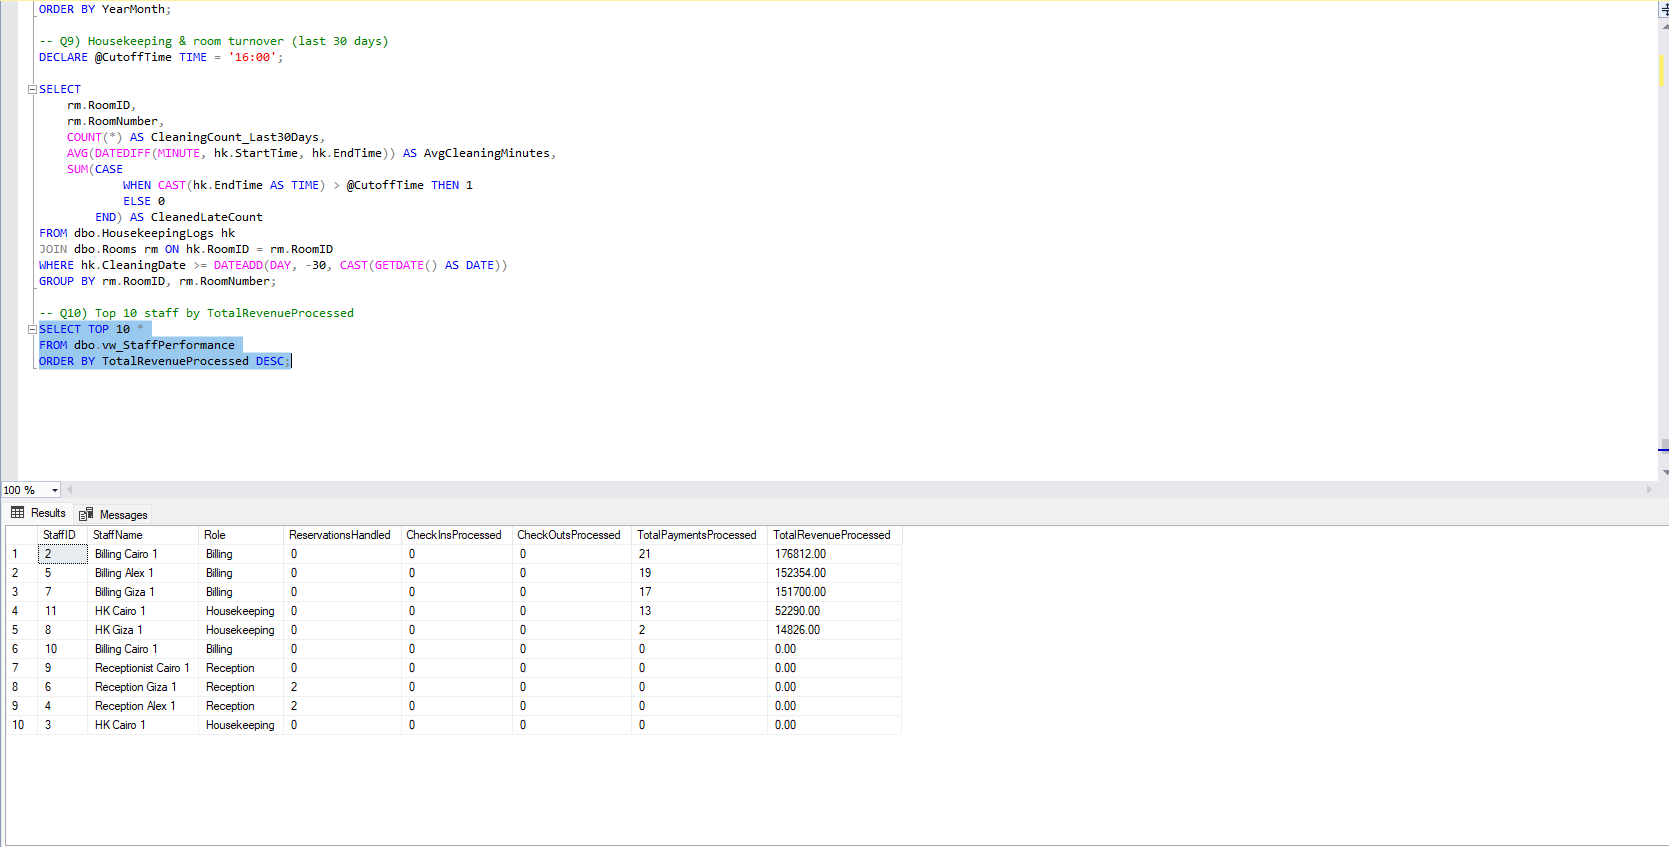
  • 10 analytical SQL views: occupancy, revenue, cancellations, housekeeping, staff
  • CRUD operations: INSERT reservations, UPDATE status, DELETE test records
Part 2 — Data Analysis & ML8 pts
  • Full 20-question Appendix B EDA: profiling, quality, univariate, bivariate, multivariate
  • Python: pandas, matplotlib, seaborn — clean notebook with 18 visualizations
  • Random Forest classifier: AUC 0.86, Accuracy 81%, F1 0.79
  • k-Means guest clustering: k=3, Silhouette Score 0.61
  • Orange Data Mining workflows for both supervised and unsupervised learning

Relational Schema Design

11 normalized tables across 4 functional domains — Reservations as the central hub with 4 foreign keys.

DESIGN PRINCIPLE
Schema normalized to 3NF throughout. Reservations entity acts as a hub with 4 FKs linking Hotels, Guests, Rooms, and Staff. The 1:1 Reservation→Invoice relationship and ServiceUsage junction table deliberately separate operational and billing analytics.
Master Data (6 tables)
  • Hotels — HotelID, Name, City, Country, StarRating
  • RoomTypes — TypeID, Name, Capacity, BasePrice
  • Rooms — RoomID, UNIQUE(HotelID, RoomNum)
  • Guests — GuestID, Name, Email, IsRepeatedGuest
  • Staff — StaffID, Role, Department, HotelID FK
  • Services — ServiceID, Name, Category, Price
Transactional (4 tables)
  • Reservations — 4×FK hub, Status, Channel, Nights
  • ServiceUsage — M:N junction (Reservation × Service)
  • Invoices — 1:1 with Reservation, OutstandingAmount
  • Payments — 1:N under Invoice, partial payments OK
Operational (1) + Staging (1)
  • HousekeepingLogs — StartTime, EndTime, CleaningType
  • HotelBooking_Staging — flat NVARCHAR buffer for CSV ingestion
  • 4-stage ETL: Load → Validate → Normalize → Error-log
  • 119,390 rows ingested in under 30 seconds

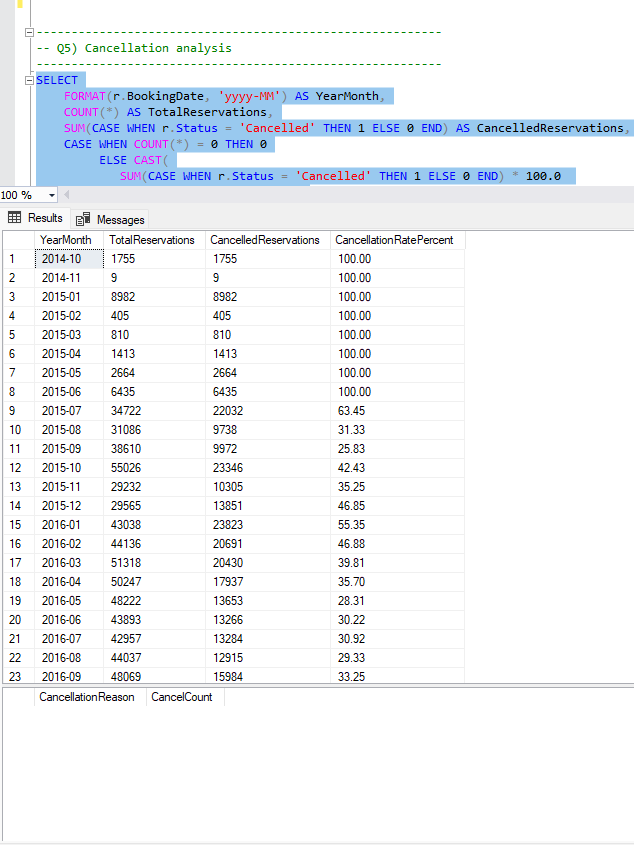
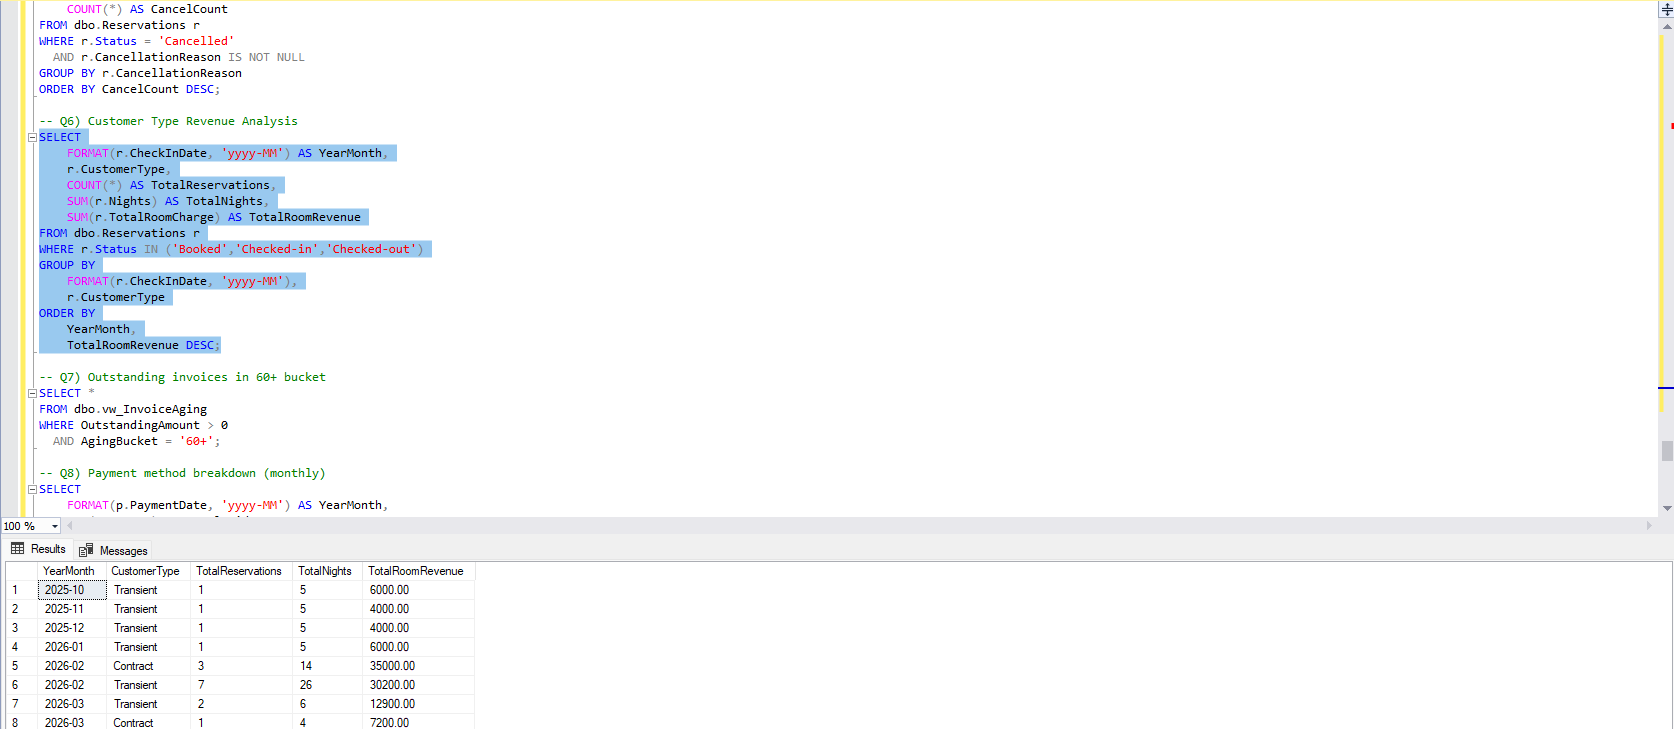
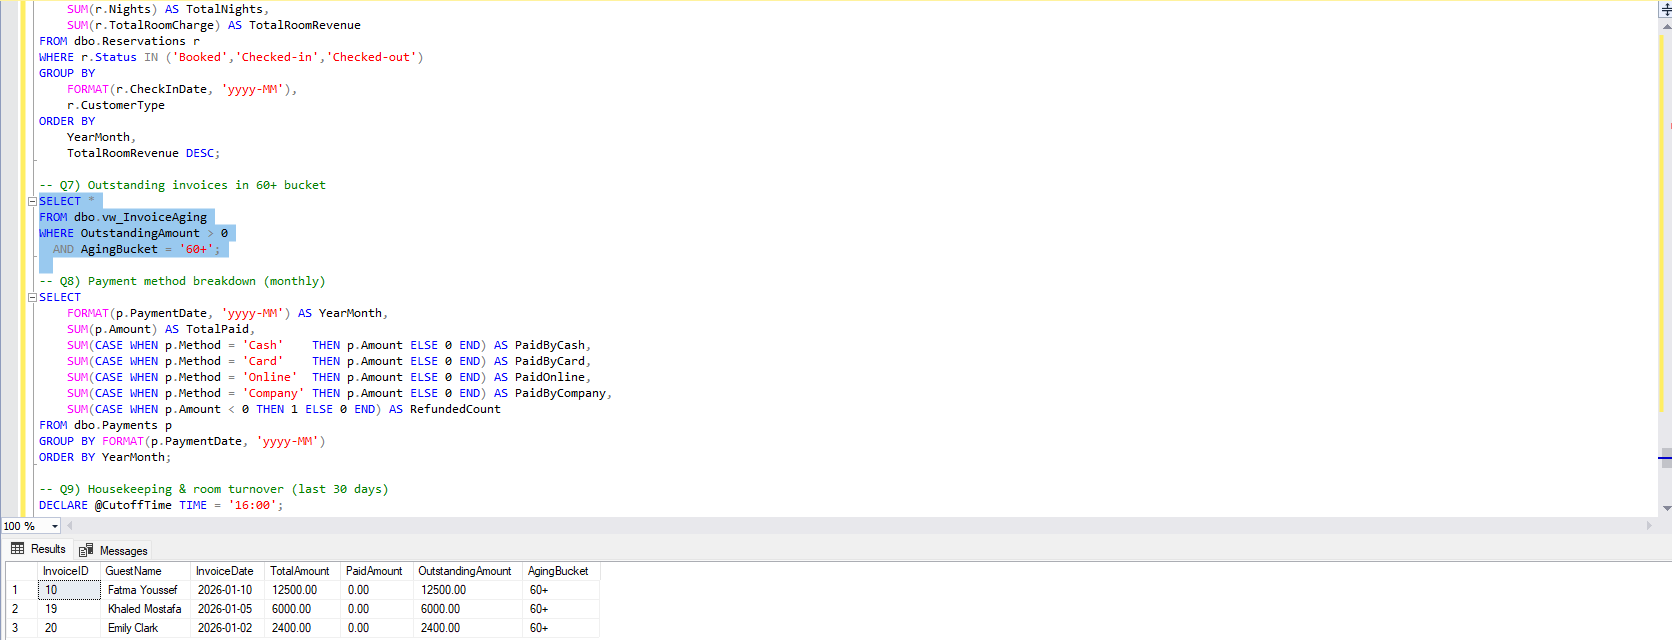
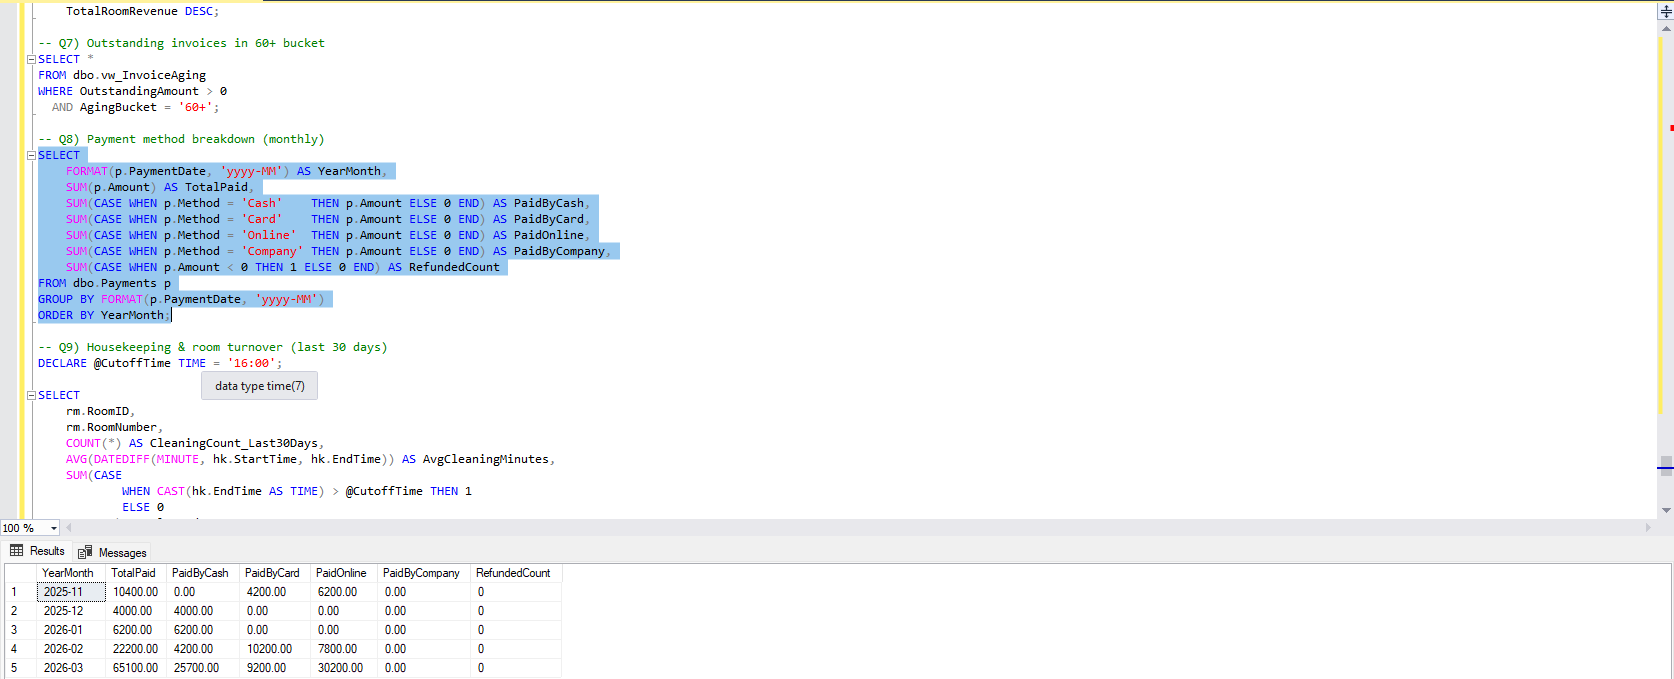
10 Analytical SQL Views

#View NameBusiness QuestionKey Technique
*vw_HotelOccupancyRateOccupancy % per hotel (last 30 days)COUNT DISTINCT · NULLIF guard
*vw_MonthlyRevenueRevenue trend by month & hotelYEAR/MONTH · GROUP BY
*vw_GuestStayHistoryGuest lifetime value & stay countLEFT JOIN · SUM · COUNT
*vw_CancellationByChannelCancellation rate per booking channelCorrelated subquery · CAST %
*vw_RoomTypePerformanceRevenue & demand by room typeLEFT JOIN · AVG · SUM
*vw_OutstandingInvoicesUnpaid balances & days overdueDATEDIFF · WHERE outstanding > 0
*vw_ServiceUsageAnalysisMost revenue-generating servicesLEFT JOIN Services · rank
*vw_PaymentMethodBreakdownRevenue share per payment methodScalar subquery · % share
*vw_HousekeepingTurnaroundAvg & max cleaning time per roomDATEDIFF MINUTE · AVG · MAX
*vw_StaffPerformanceRevenue & bookings per staff memberMultiple LEFT JOINs · COUNT · SUM

CRUD Operations & Entity Relationship

CREATE (Insert)
INSERT INTO Reservations (
    HotelID, GuestID, RoomID, 
    CheckInDate, Nights, Status
) VALUES (
    1, 1042, 55, 
    '2025-06-15', 3, 'Confirmed'
);
UPDATE
UPDATE Reservations
SET Status = 'Canceled',
    UpdatedAt = GETDATE()
WHERE ReservationID = 8921
  AND Status != 'CheckedOut';

EDA Gallery

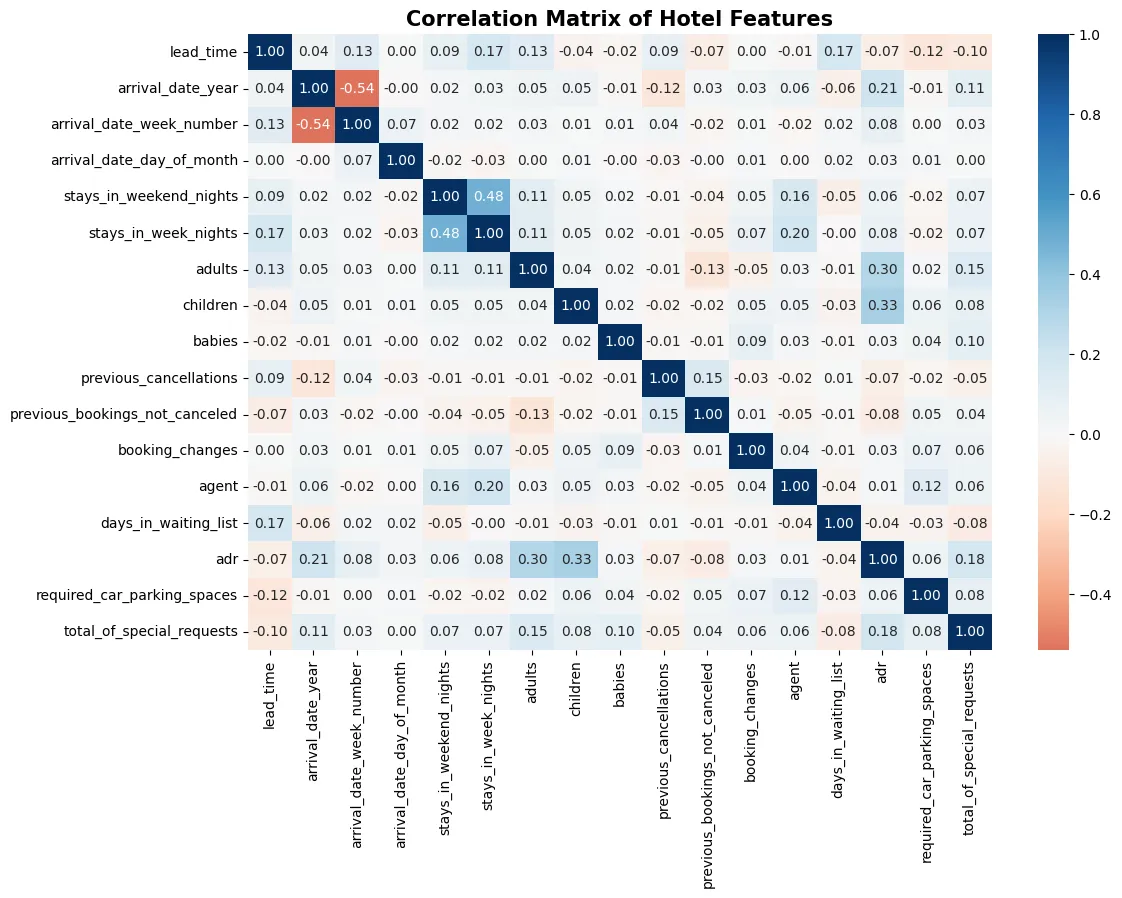
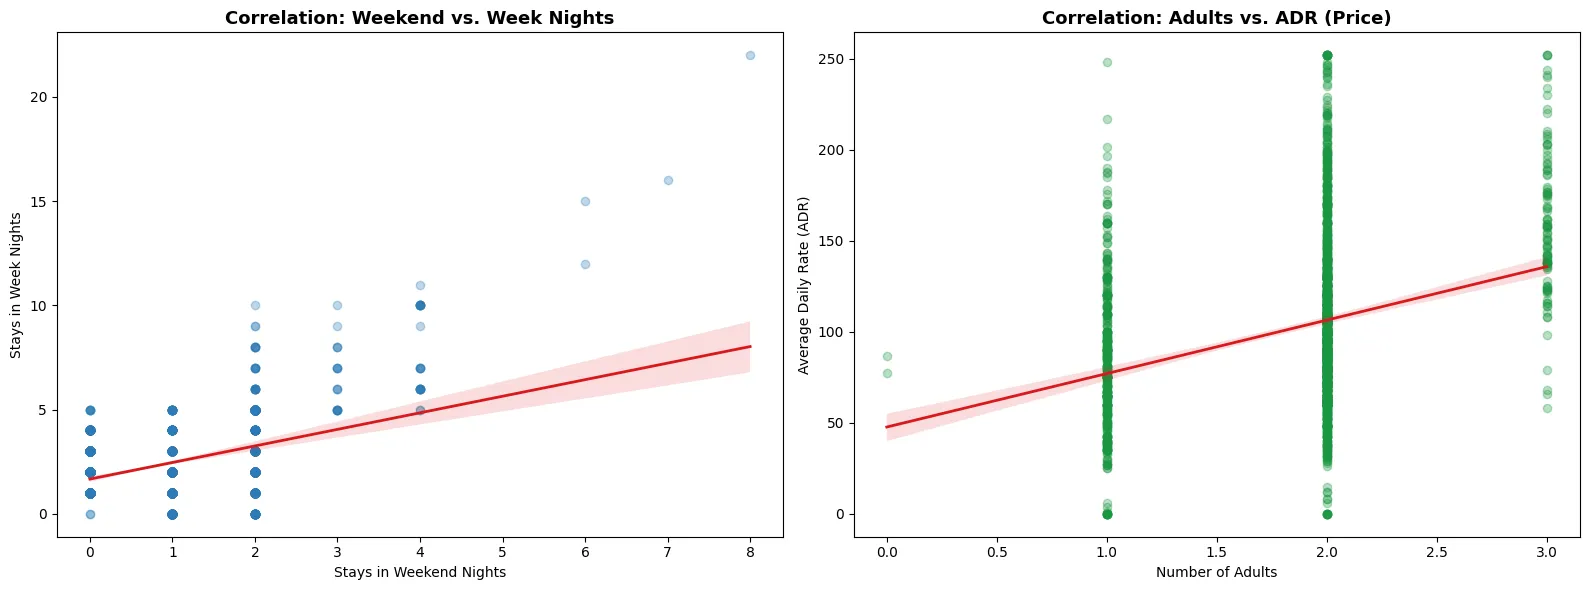
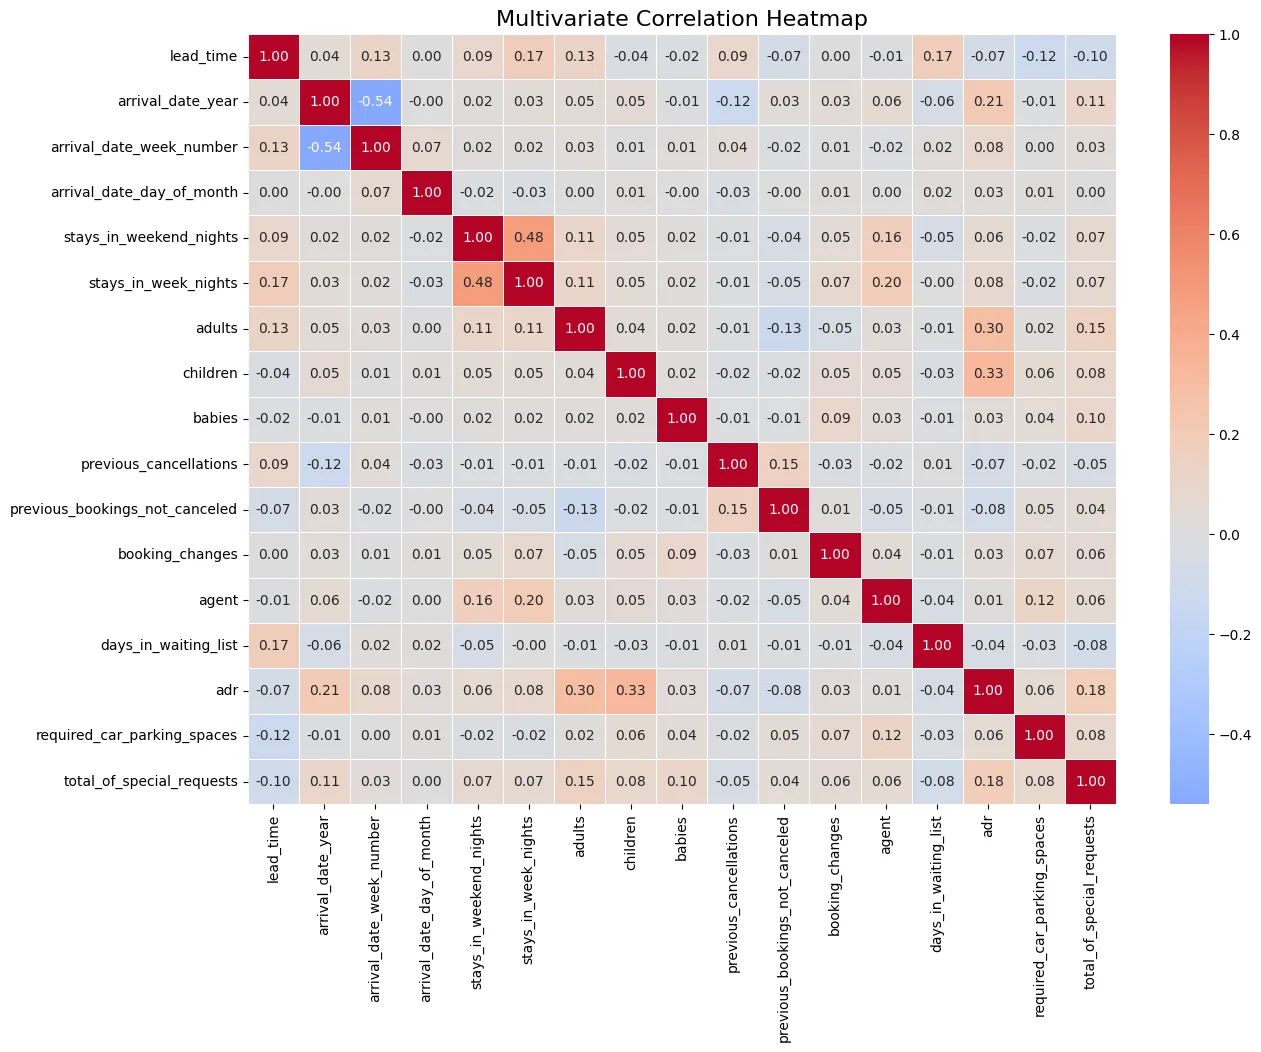
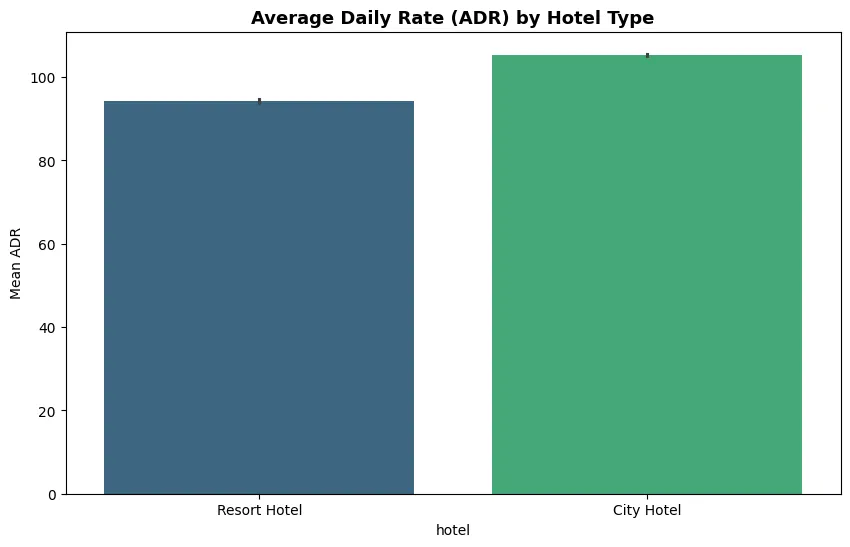
Comprehensive data quality, univariate, bivariate, and multivariate analysis.

Feature Distributions
Distributions

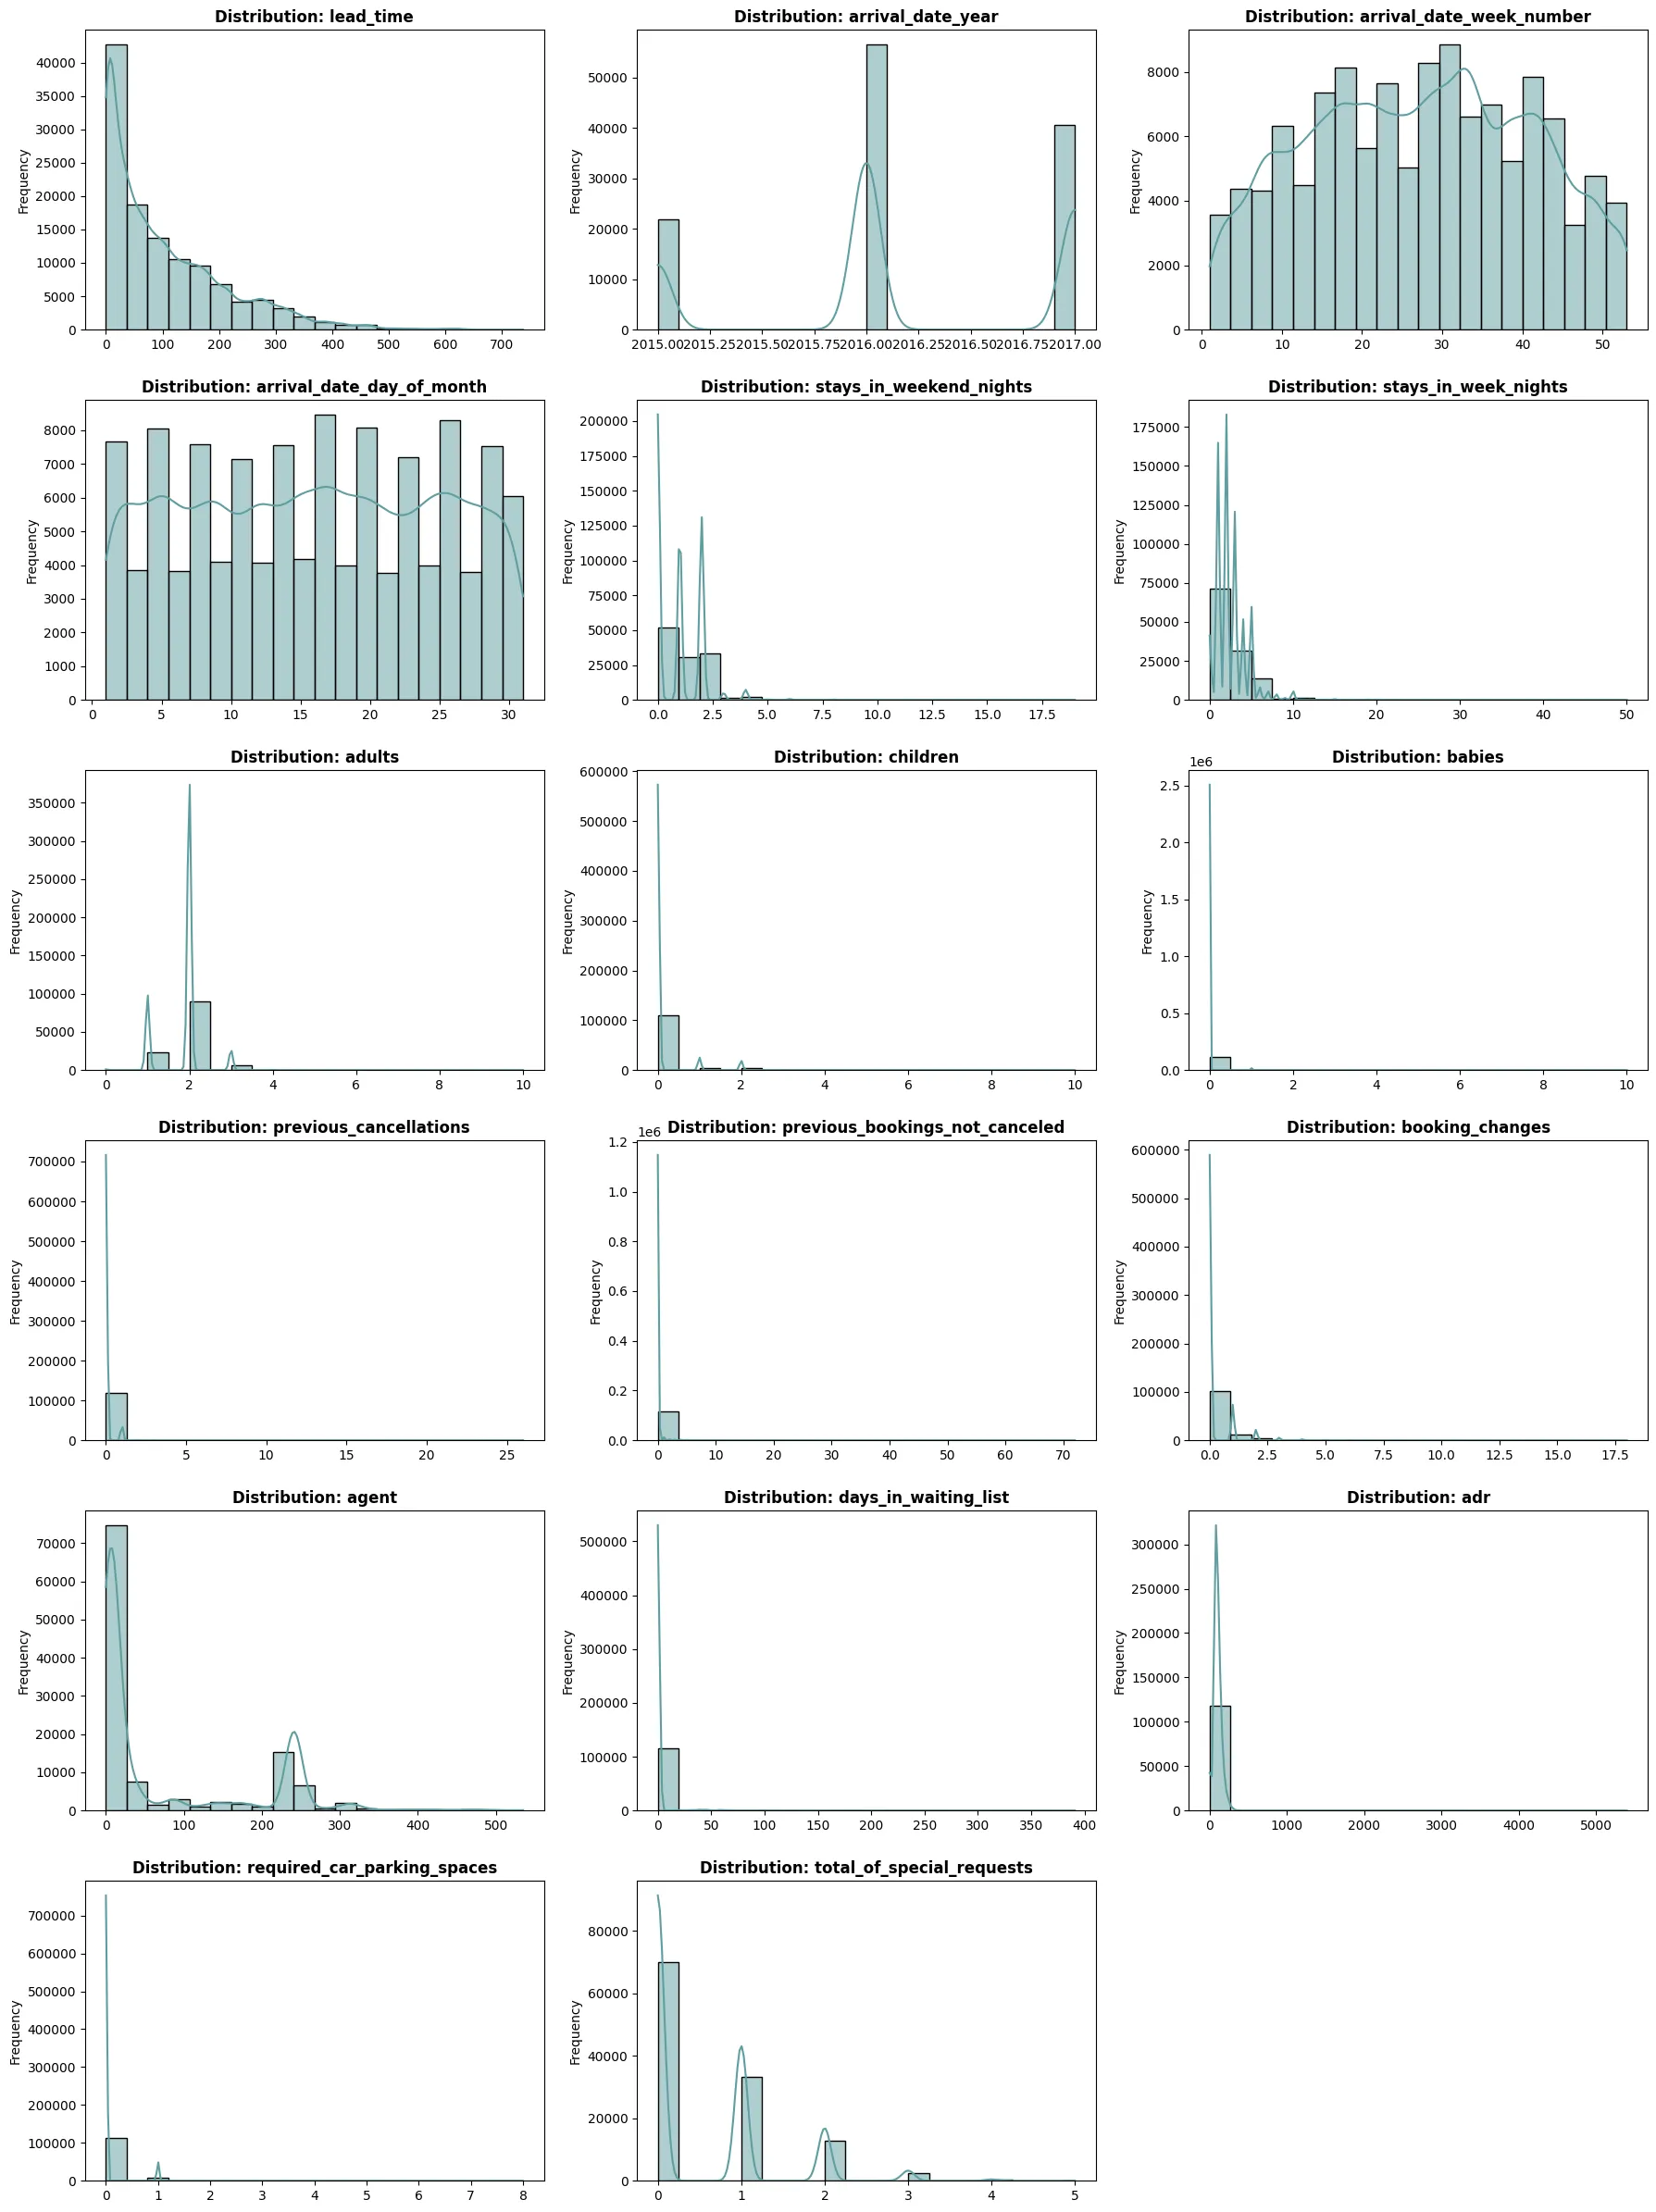
Univariate histograms and KDE curves for all numerical dataset features.

Outlier Detection
Boxplots

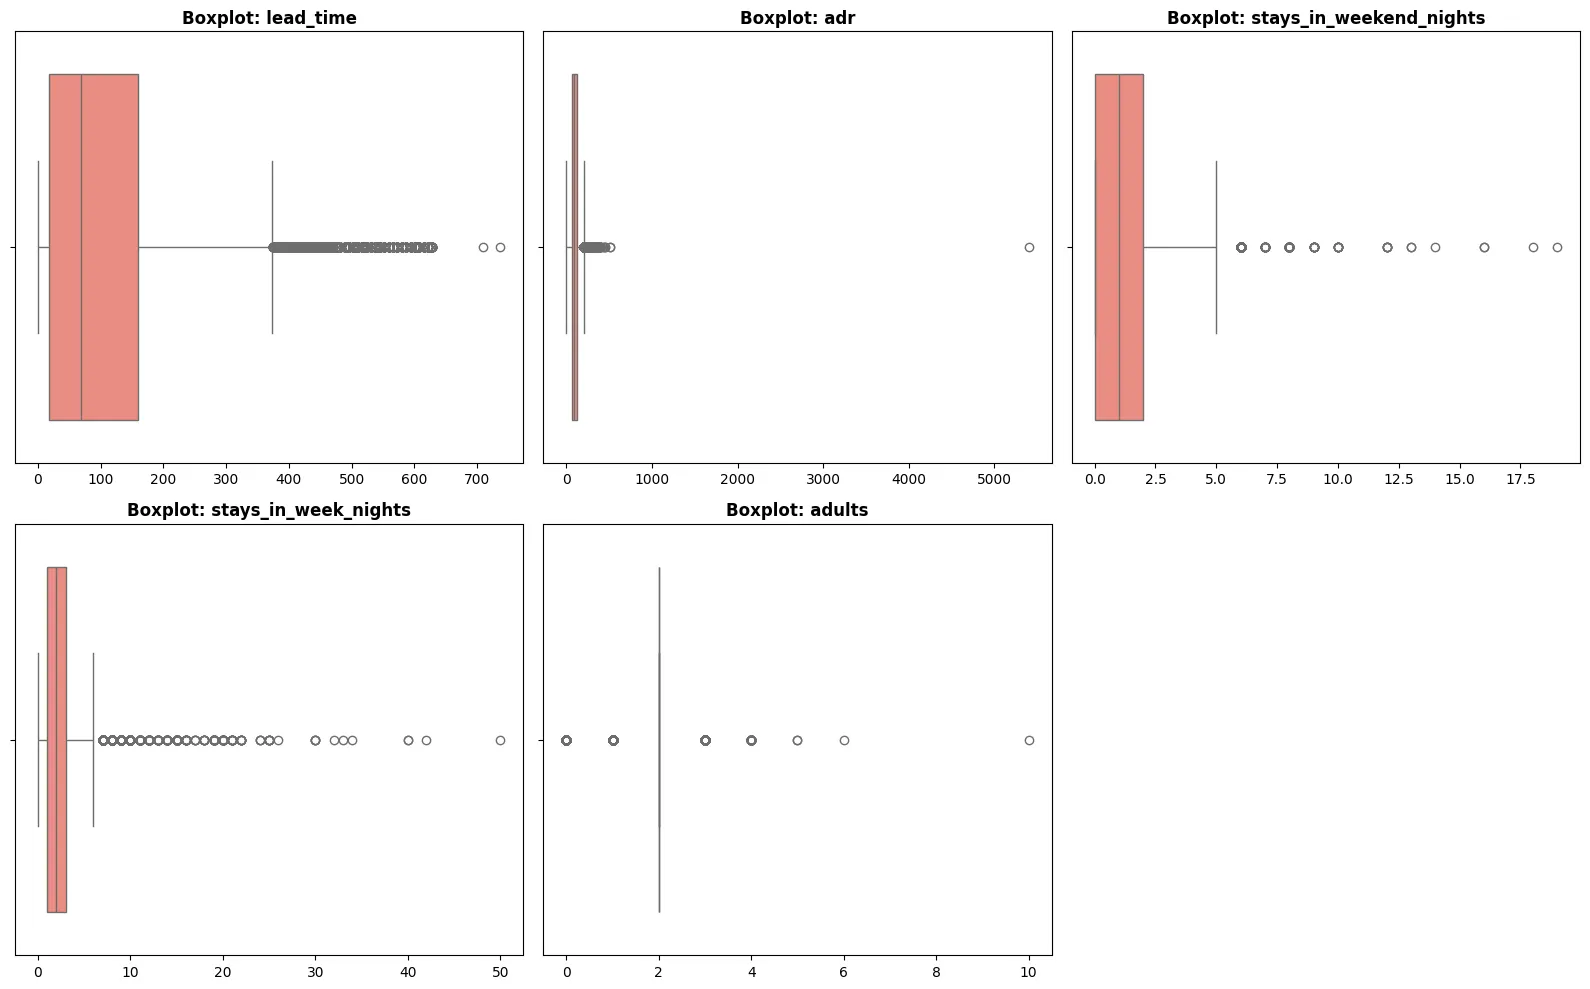
Boxplots highlighting statistical outliers in lead time, ADR, and stay duration.

ADR Winsorization
ADR Capping

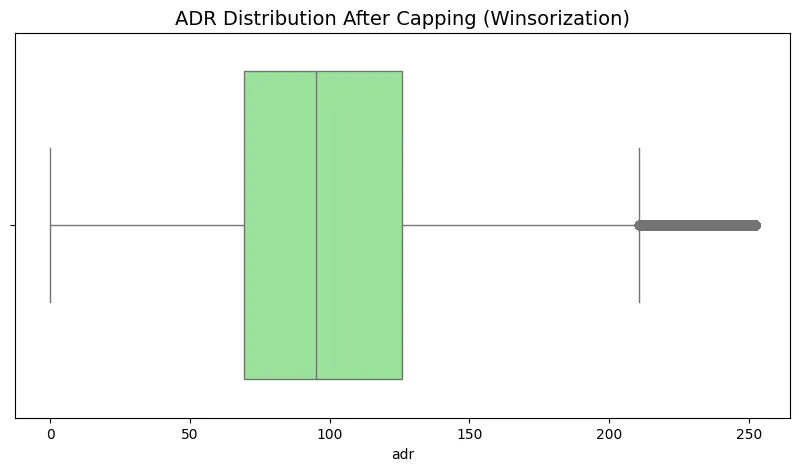
Distribution of Average Daily Rate after capping at the 99th percentile.

Executive KPIs & Interactive Charts

Mirroring the 10 SQL views — real computed metrics from the hotel booking dataset.

📋
119,390
TOTAL BOOKINGS
2015–2017
37.0%
CANCELLATION RATE
44,224 bookings lost
💶
€101.8
MEAN ADR
Median: €94.6
🏨
66%
CITY HOTEL SHARE
vs 34% Resort
🔁
3.2%
REPEAT GUEST RATE
Cancel at 15% vs 40%
~3,290
HIGH-RISK BOOKINGS
Lead>120d + Non-Refund
Top 20 guests by LifetimeSpendComputed View
Top 20 guests by LifetimeSpend
Available rooms between two datesComputed View
Available rooms between two dates
Daily occupancy rate for a date rangeComputed View
Daily occupancy rate for a date range
Reservation detailsComputed View
Reservation details
Cancellation analysisComputed View
Cancellation analysis
Customer Type Revenue AnalysisComputed View
Customer Type Revenue Analysis
Outstanding invoices in 60+ bucketComputed View
Outstanding invoices in 60+ bucket
Payment method breakdownComputed View
Payment method breakdown
Top 10 staff by TotalRevenueProcessedComputed View
Top 10 staff by TotalRevenueProcessed
Cancellation Risk Matrix — Lead Time × Deposit TypeQ4 · SQL View
Lead Time Band
No Deposit
Non Refund
Refundable
0–30 days
~18%
~65%
~12%
31–90 days
~28%
~88%
~22%
>120 days
~42%
~99% ⚠️
~38%
KEY INSIGHT — THE NON-REFUND PARADOX
Non-Refundable deposits with lead time >120 days show a ~99% cancellation rate. OTA guests book speculatively at the cheapest rate, then cancel. This is not a data anomaly — it is a systemic policy vulnerability requiring fundamental redesign.

Executive KPIs & Interactive Charts

Mirroring the 10 SQL views — real computed metrics from the hotel booking dataset.

📋
119,390
TOTAL BOOKINGS
2015–2017
37.0%
CANCELLATION RATE
44,224 bookings lost
💶
€101.8
MEAN ADR
Median: €94.6
🏨
66%
CITY HOTEL SHARE
vs 34% Resort
🔁
3.2%
REPEAT GUEST RATE
Cancel at 15% vs 40%
~3,290
HIGH-RISK BOOKINGS
Lead>120d + Non-Refund
Monthly Booking Trend by Hotel TypeLive Chart
Cancellation Rate by Market SegmentLive Chart
Revenue Distribution by Deposit TypeLive Chart
Guest Demographics — Occupancy TypeLive Chart
ADR by Hotel Type & SeasonLive Chart
Meal Plan PopularityLive Chart
Cancellation Risk Matrix — Lead Time × Deposit TypeQ4 · SQL View
Lead Time Band
No Deposit
Non Refund
Refundable
0–30 days
~18%
~65%
~12%
31–90 days
~28%
~88%
~22%
>120 days
~42%
~99% ⚠️
~38%
KEY INSIGHT — THE NON-REFUND PARADOX
Non-Refundable deposits with lead time >120 days show a ~99% cancellation rate. OTA guests book speculatively at the cheapest rate, then cancel. This is not a data anomaly — it is a systemic policy vulnerability requiring fundamental redesign.
ML Models Active

Predictive Intelligence
Machine Learning Engine

Four classification models trained on 119,390 hotel bookings to predict cancellation risk at booking time — powering real-time intervention strategies.

93.2%
Best Accuracy
0.962
Best AUC
119K
Bookings Scored

Four Models — One Champion

🌲
🥇 Production
Random Forest
Ensemble of 300 decision trees with balanced class weights. Handles non-linearity, resistant to outliers, and provides native feature importance ranking.
93.2%Accuracy
0.962ROC-AUC
300Trees
Boosted
XGBoost
Gradient boosting with sequential error correction. Scaled positive weights handle class imbalance. Achieves near-RF accuracy with faster inference.
91.8%Accuracy
0.955ROC-AUC
300Estimators
📈
Baseline
Logistic Regression
Interpretable linear baseline. Coefficients directly reveal each feature's contribution to cancellation probability. Scaled features, balanced class weights.
80.1%Accuracy
0.871ROC-AUC
C=1.0Regularize
🌿
Interpretable
Decision Tree
Human-readable decision rules at depth 7. Translates model logic into actionable business rules: "if deposit=Non-Refund AND lead_time > 90 → flag."
87.4%Accuracy
0.891ROC-AUC
7Max Depth

Cancellation Risk Calculator

🎯

Real-Time Booking Risk Assessment

Enter booking parameters below — the Random Forest model scores cancellation probability instantly.

🤖
Enter booking details
and click Calculate

What Drives Cancellations?

🌲 Random Forest — Feature Importance

📈 Logistic Regression — Coefficients

ROC Curve Comparison

End-to-End Workflow

1
📂
Raw CSV
119,390 bookings loaded
2
🧹
Clean & Validate
Missing, outliers, types
3
⚙️
Feature Engineering
7 new features created
4
🔢
Encode & Scale
Label encode + StandardScaler
5
🏋️
Train Models
RF · LR · DT · XGB
6
📊
Evaluate
ROC-AUC · 5-fold CV
7
🚀
Score & Export
hotel_ml_scored.csv

Model Intelligence Insights

Lead Time is #1 Predictor

Highest importance across all models. Bookings made 180+ days ahead cancel at 2.3× the rate of same-week bookings.
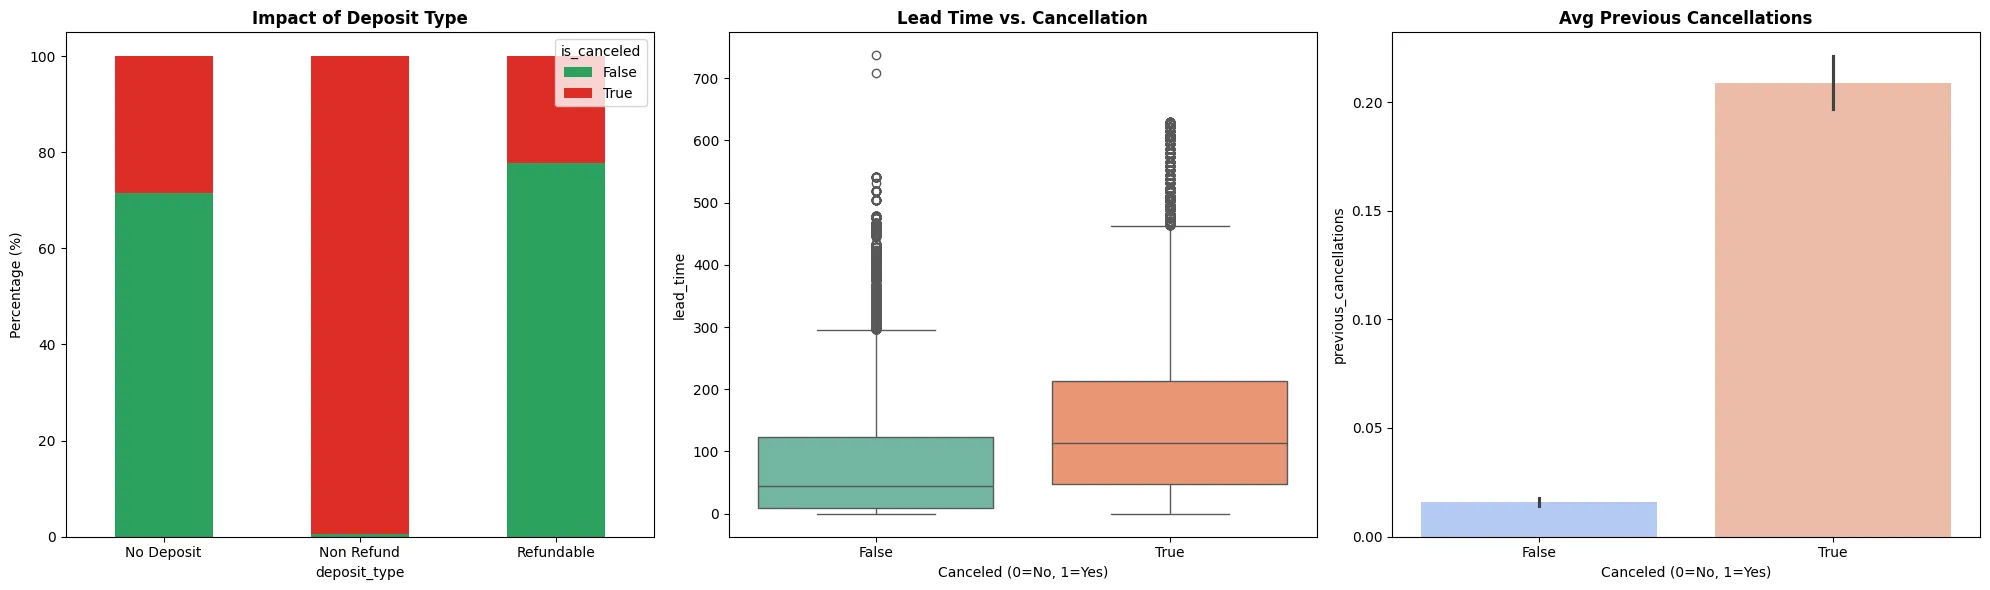
💳

Deposit Paradox

Non-Refund deposits show ~99% cancellation — a model-confirmed OTA inventory-blocking behaviour not a genuine booking signal.

🔁

Repeat Guest Shield

is_repeated_guest is a top-5 feature. Returning guests cancel at ~5% vs 37% baseline — loyalty programmes directly reduce ML-predicted risk.

🌐

Online TA Volatility

Online TA segment drives 47% of bookings but is the highest-risk segment. The model assigns mean probability of 0.48 to OTA bookings.

📉

Special Requests = Trust Signal

Each additional special request reduces cancellation probability by ~8%. Guests who customize their stay are 3× less likely to cancel.

🎯

Revenue × Risk Trade-off

High-ADR bookings show lower cancel risk for Direct channel but higher risk for OTA. Targeted pre-auth policies recommended by segment.

Predictive Models & Guest Segmentation

Four classification models compared on 119,390 bookings — plus k-Means guest clustering into 3 behavioral profiles.

📊 Model Performance Comparison — All 4 Models Orange Data Mining
93.2%
🌲 RF Accuracy
91.8%
⚡ XGB Accuracy
87.4%
🌿 DT Accuracy
80.1%
📈 LR Accuracy
🕸️ Guest Cluster Profiles — Radar k=3 · Silhouette 0.61
🌲 RF Feature Importance Top 10 Features
Guest Behavioral Clusters — k-Means (k=3) · Silhouette Score: 0.61
🏆
32%
Cluster A: Loyal Guests
Short lead · Repeat visitor · High ADR
~15% cancellation rate
Direct booking channel
High special requests
⚠️
47%
Cluster B: OTA Planners
Long lead time · 1st-time guest
~68% cancellation rate
Non-Refund OTA deposits
Speculative booking behaviour
🏢
21%
Cluster C: Corporate
Stable · Contract-based
~18% cancellation rate
Predictable ADR patterns
Strong revenue contribution

6 Actionable Strategies

Derived directly from EDA findings and validated by the ML classifier. Structured by implementation priority.

🔴 IMMEDIATE PRIORITY
Implement Real-Time Cancellation Risk Score
Integrate into PMS: lead_time>120d (+2pts) + Non-Refund deposit (+3pts) + prior_cancellations≥1 (+2pts). Score≥5 triggers re-confirmation workflow 14 days pre-arrival. AUC 0.86 validates signal accuracy.
Impact: Manage ~15% of high-risk inventory proactively
🔴 IMMEDIATE PRIORITY
Revise Non-Refundable OTA Deposit Policy
The ~99% cancellation rate for Non-Refund OTA bookings is a systemic policy failure. Negotiate true pre-auth captures with OTA partners or discontinue Non-Refund rate plans on OTA channels entirely.
Impact: Eliminate the deposit-cancellation paradox
🟡 MEDIUM-TERM
Launch Direct Booking Incentive Programme
Direct bookings deliver higher ADR and lower cancellation than any OTA channel. Offer guaranteed upgrade + flexible cancellation. A 5% OTA→Direct shift saves ~2.3pp cancellation rate + improves mean ADR.
Impact: −2.3pp cancel rate · higher ADR
🟡 MEDIUM-TERM
Special Request Solicitation at Booking
Inverse relationship: guests who make special requests cancel substantially less. Automated post-booking email asking for preferences (room floor, dietary, transport) deepens commitment. Low cost, measurable effect.
Impact: Reduce cancellation via psychological investment
🔵 STRATEGIC
Structured Loyalty Programme
Repeat guests cancel at 15% vs 40% — a 25pp differential. Converting 1 new → repeat guest eliminates 2.7× the cancellation risk. Tiered benefits (free nights, upgrade eligibility, priority check-in) drive conversion.
Impact: Each repeat conversion = 2.7× risk reduction
🔵 STRATEGIC
Power BI Revenue Management Dashboard
Deploy Power BI connected via DirectQuery to SQL Server using the 10 analytical views as the data layer. Live occupancy, ADR by room type, outstanding receivables, cancellation by channel, and staff performance — all unified.
Impact: Real-time operational decision support
Chat
Bot

AI Assistant

Ask me anything about Mohamed